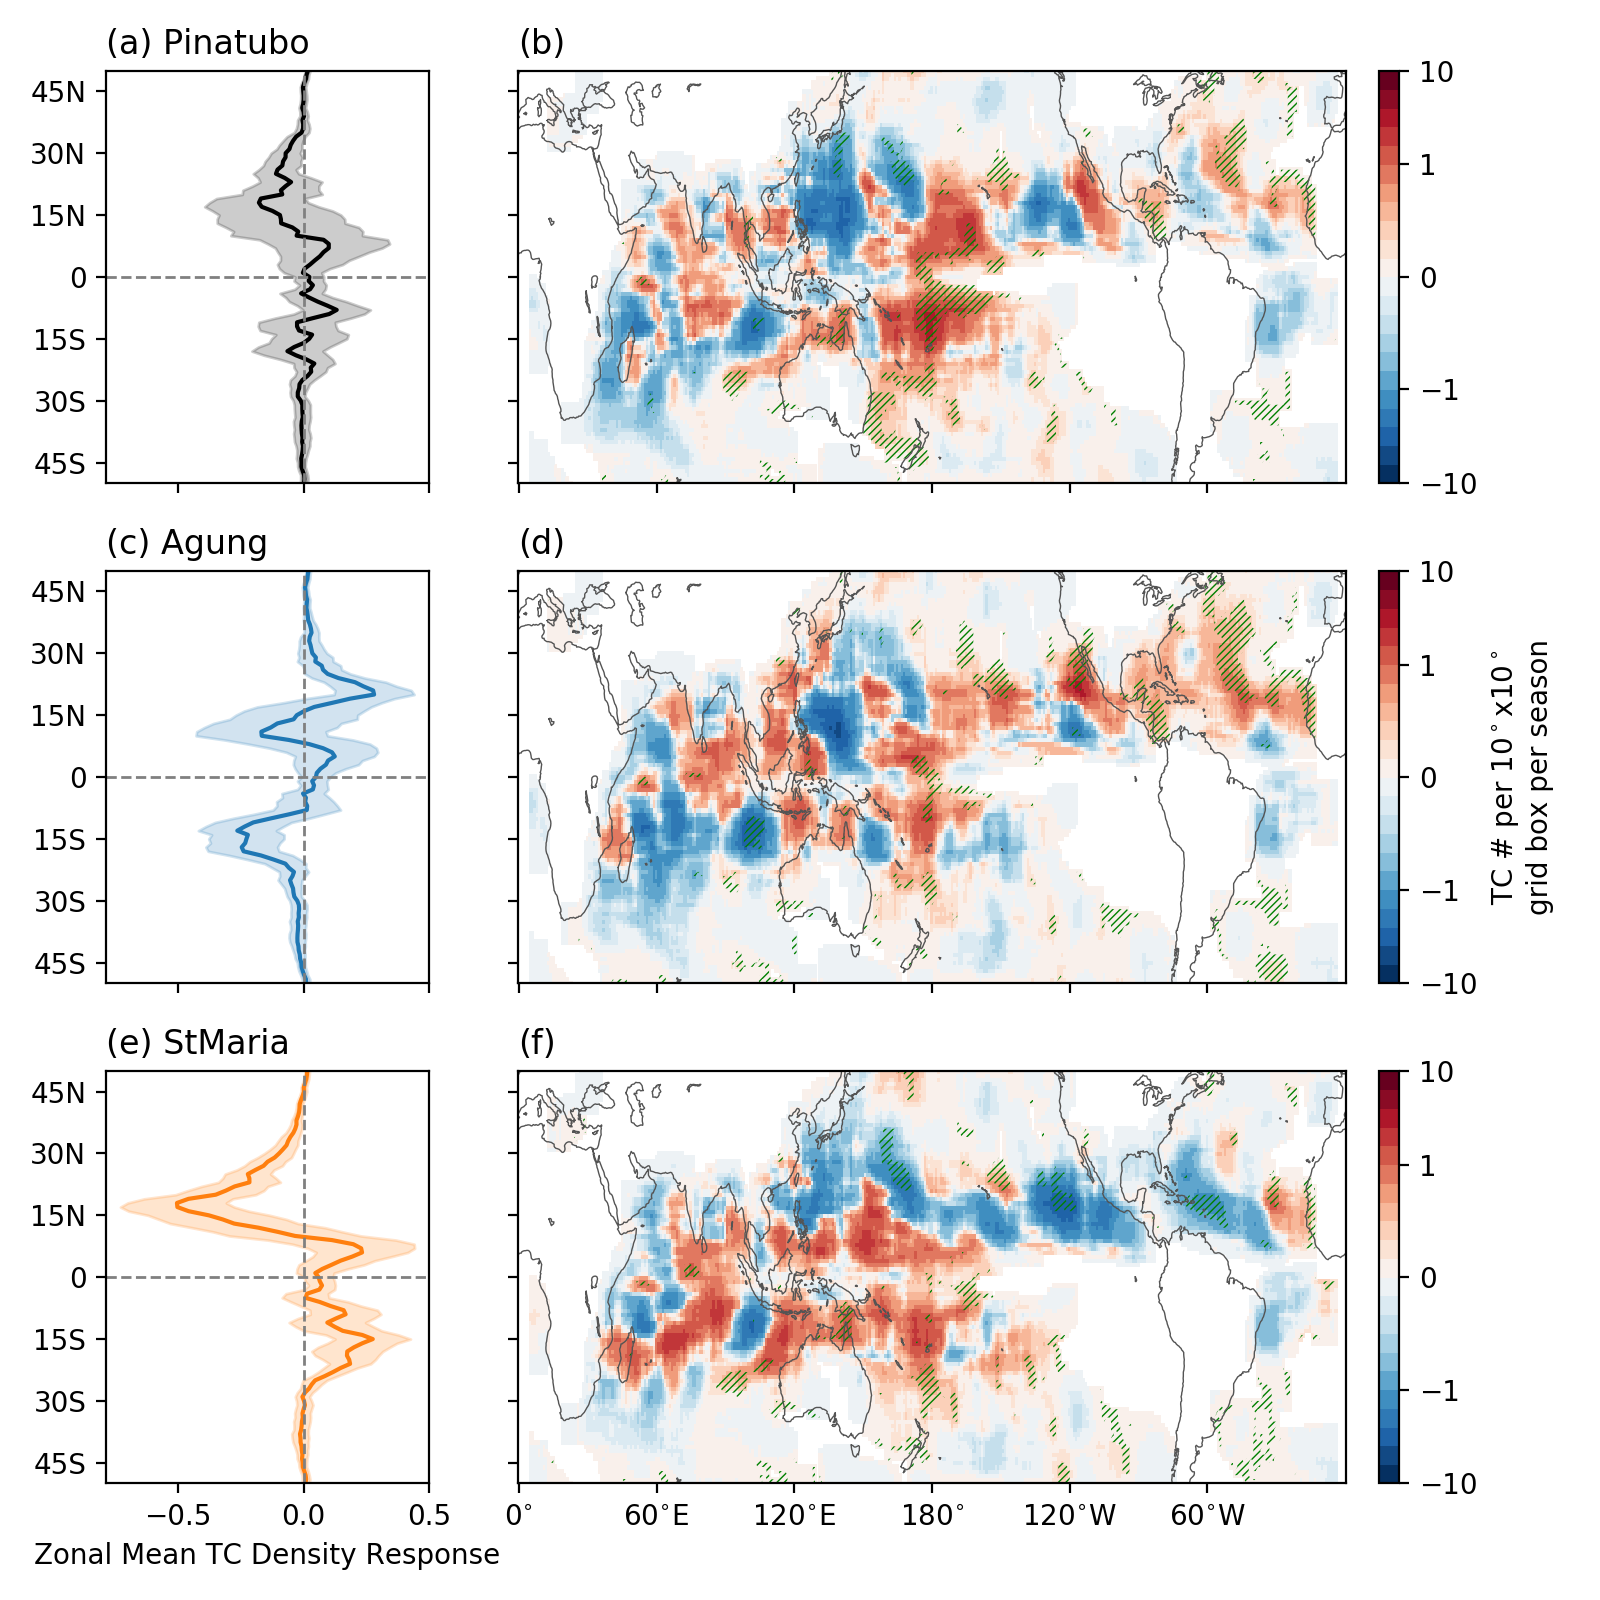
From Yang et al. 2019: Response of TC track density to volcanic eruptions with different radiative forcings.
How the climate responds to radiative forcing, particularly to the injection of sulfate aerosols, is an important question.
Some of the largest volcanic events over the last century, have released up to 30 Tg (Pinatubo) of sulfate into the global stratosphere.
Probing the impacts of these volcanic eruptions offers insights into how these explosive events impact components of the climate system, such as tropical cyclones, El Nino events, and Arctic Sea Ice.
To improve our understanding of how the location of the volcanic eruption influences its climate impact, we use a coupled climate model (FLOR) to investigate the impacts of three eruptions (Pinatubo, Agung, and Santa Maria), which varied in their forcing: The Pinatubo eruption had largest sulfate loading with equal impacts in the Northern and Southern hemispheres, while Agung and Santa Maria had smaller sulfate loading with disproportionate impacts in the Southern and Northern hemispheres, respectively.
Results build on previous studies that showed radiative forcing structure, beyond that of aerosol loading, impact global and regional temperature and precipitation.
We illustrate that Agung and Santa Maria (lower aerosol loadings) more strongly impacted Tropical Cyclone Activity and shifted the Tropical Cyclones and Intertropical Convergence Zone away from the hemisphere associated with the aerosol loading.
Of the three volcanic eruptions, Pinatubo was by far the largest, with seven times more aerosol loading than Santa Maria, yet due to spatial forcing differences, Santa Maria resulted in the largest climate sensitivities.
The majority of current climate models do not accurately reconstruct the spatial structure of volcanic aerosols and therefore the disproportionate impacts of volcanic eruptions on regional scales, which lead to larger scale climate sensitivities as demonstrated by this study, are not represented in model output.
This highlights that it is critical to take the spatial structure of volcanic aerosol radiative properties into account when climate models are used to ask questions such as – how have past volcanic eruptions impacted climate, especially when focusing on the hydroclimate and large scale phenomena.
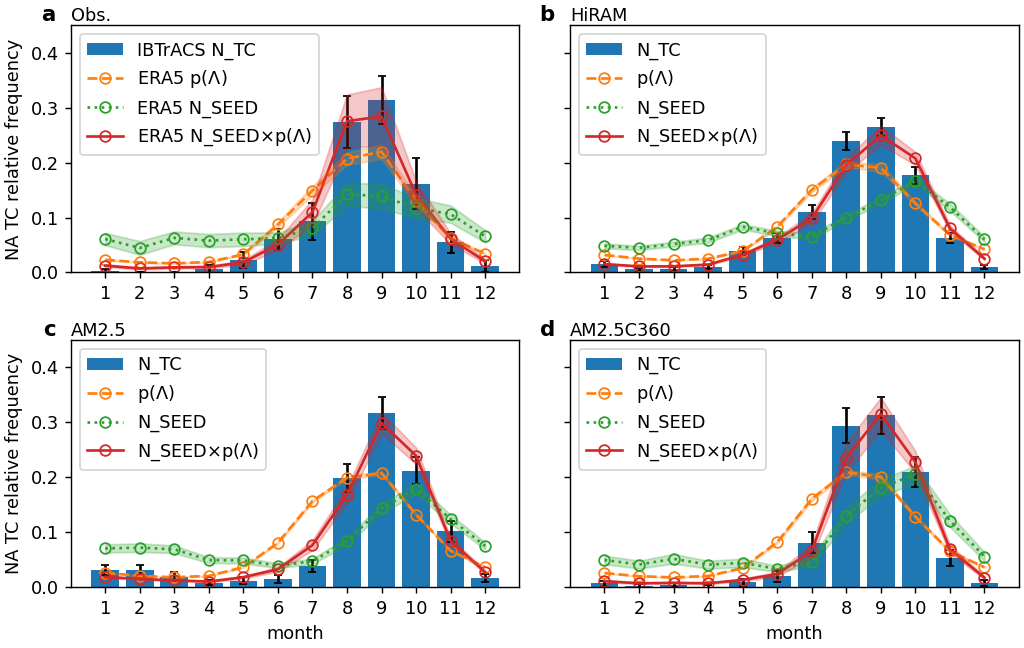
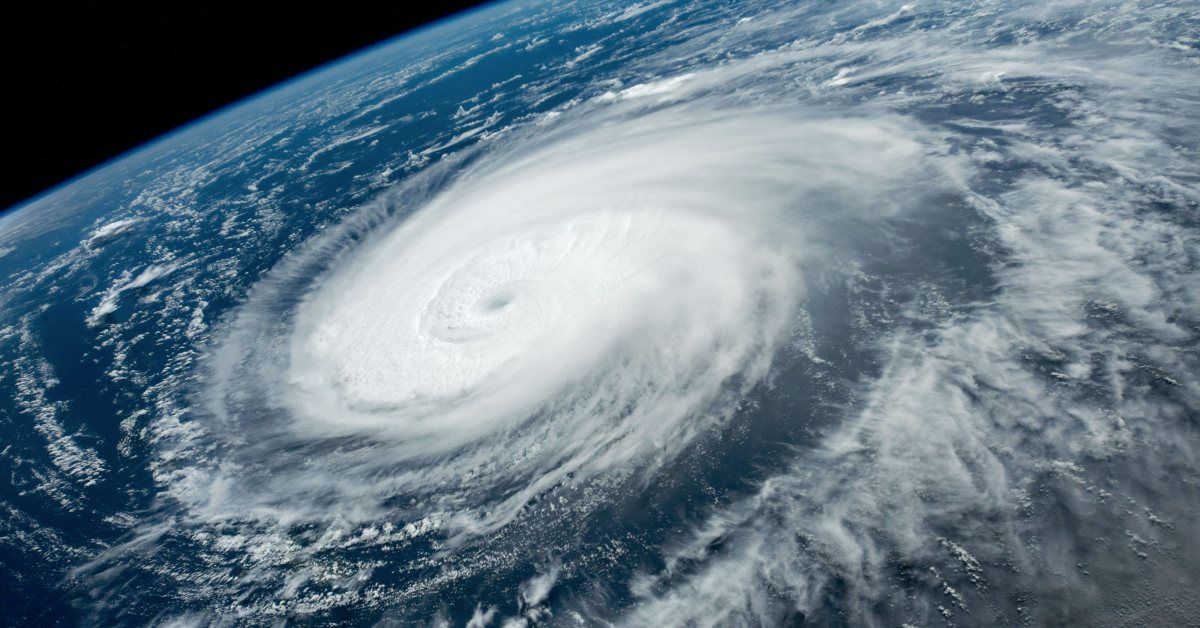 Tropical Cyclones
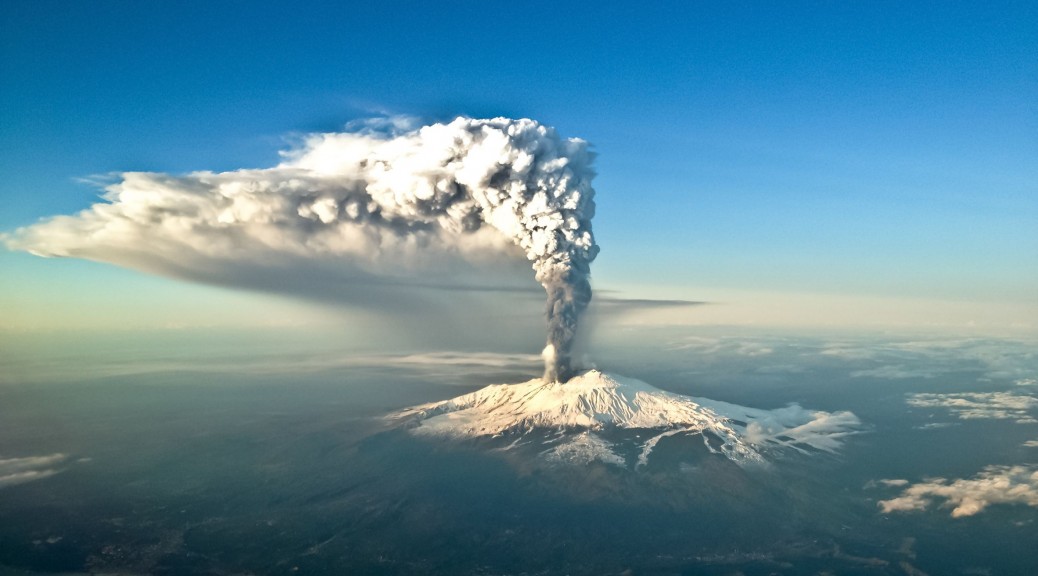 Volcanic Eruptions and Climate
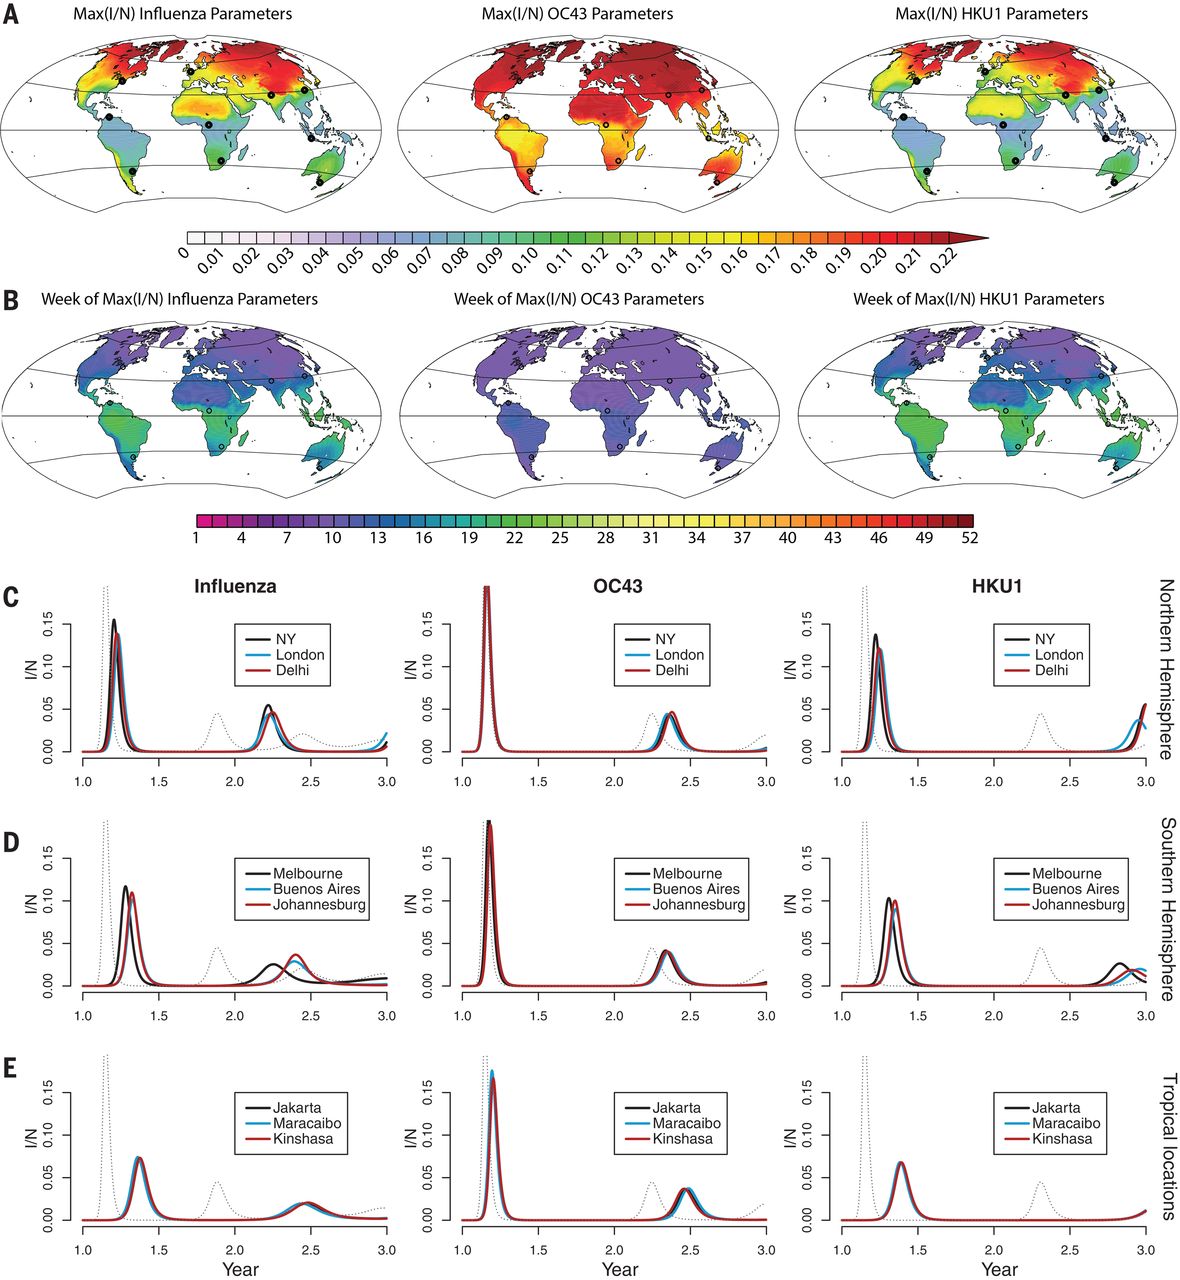
 Climate and Infectious Disease
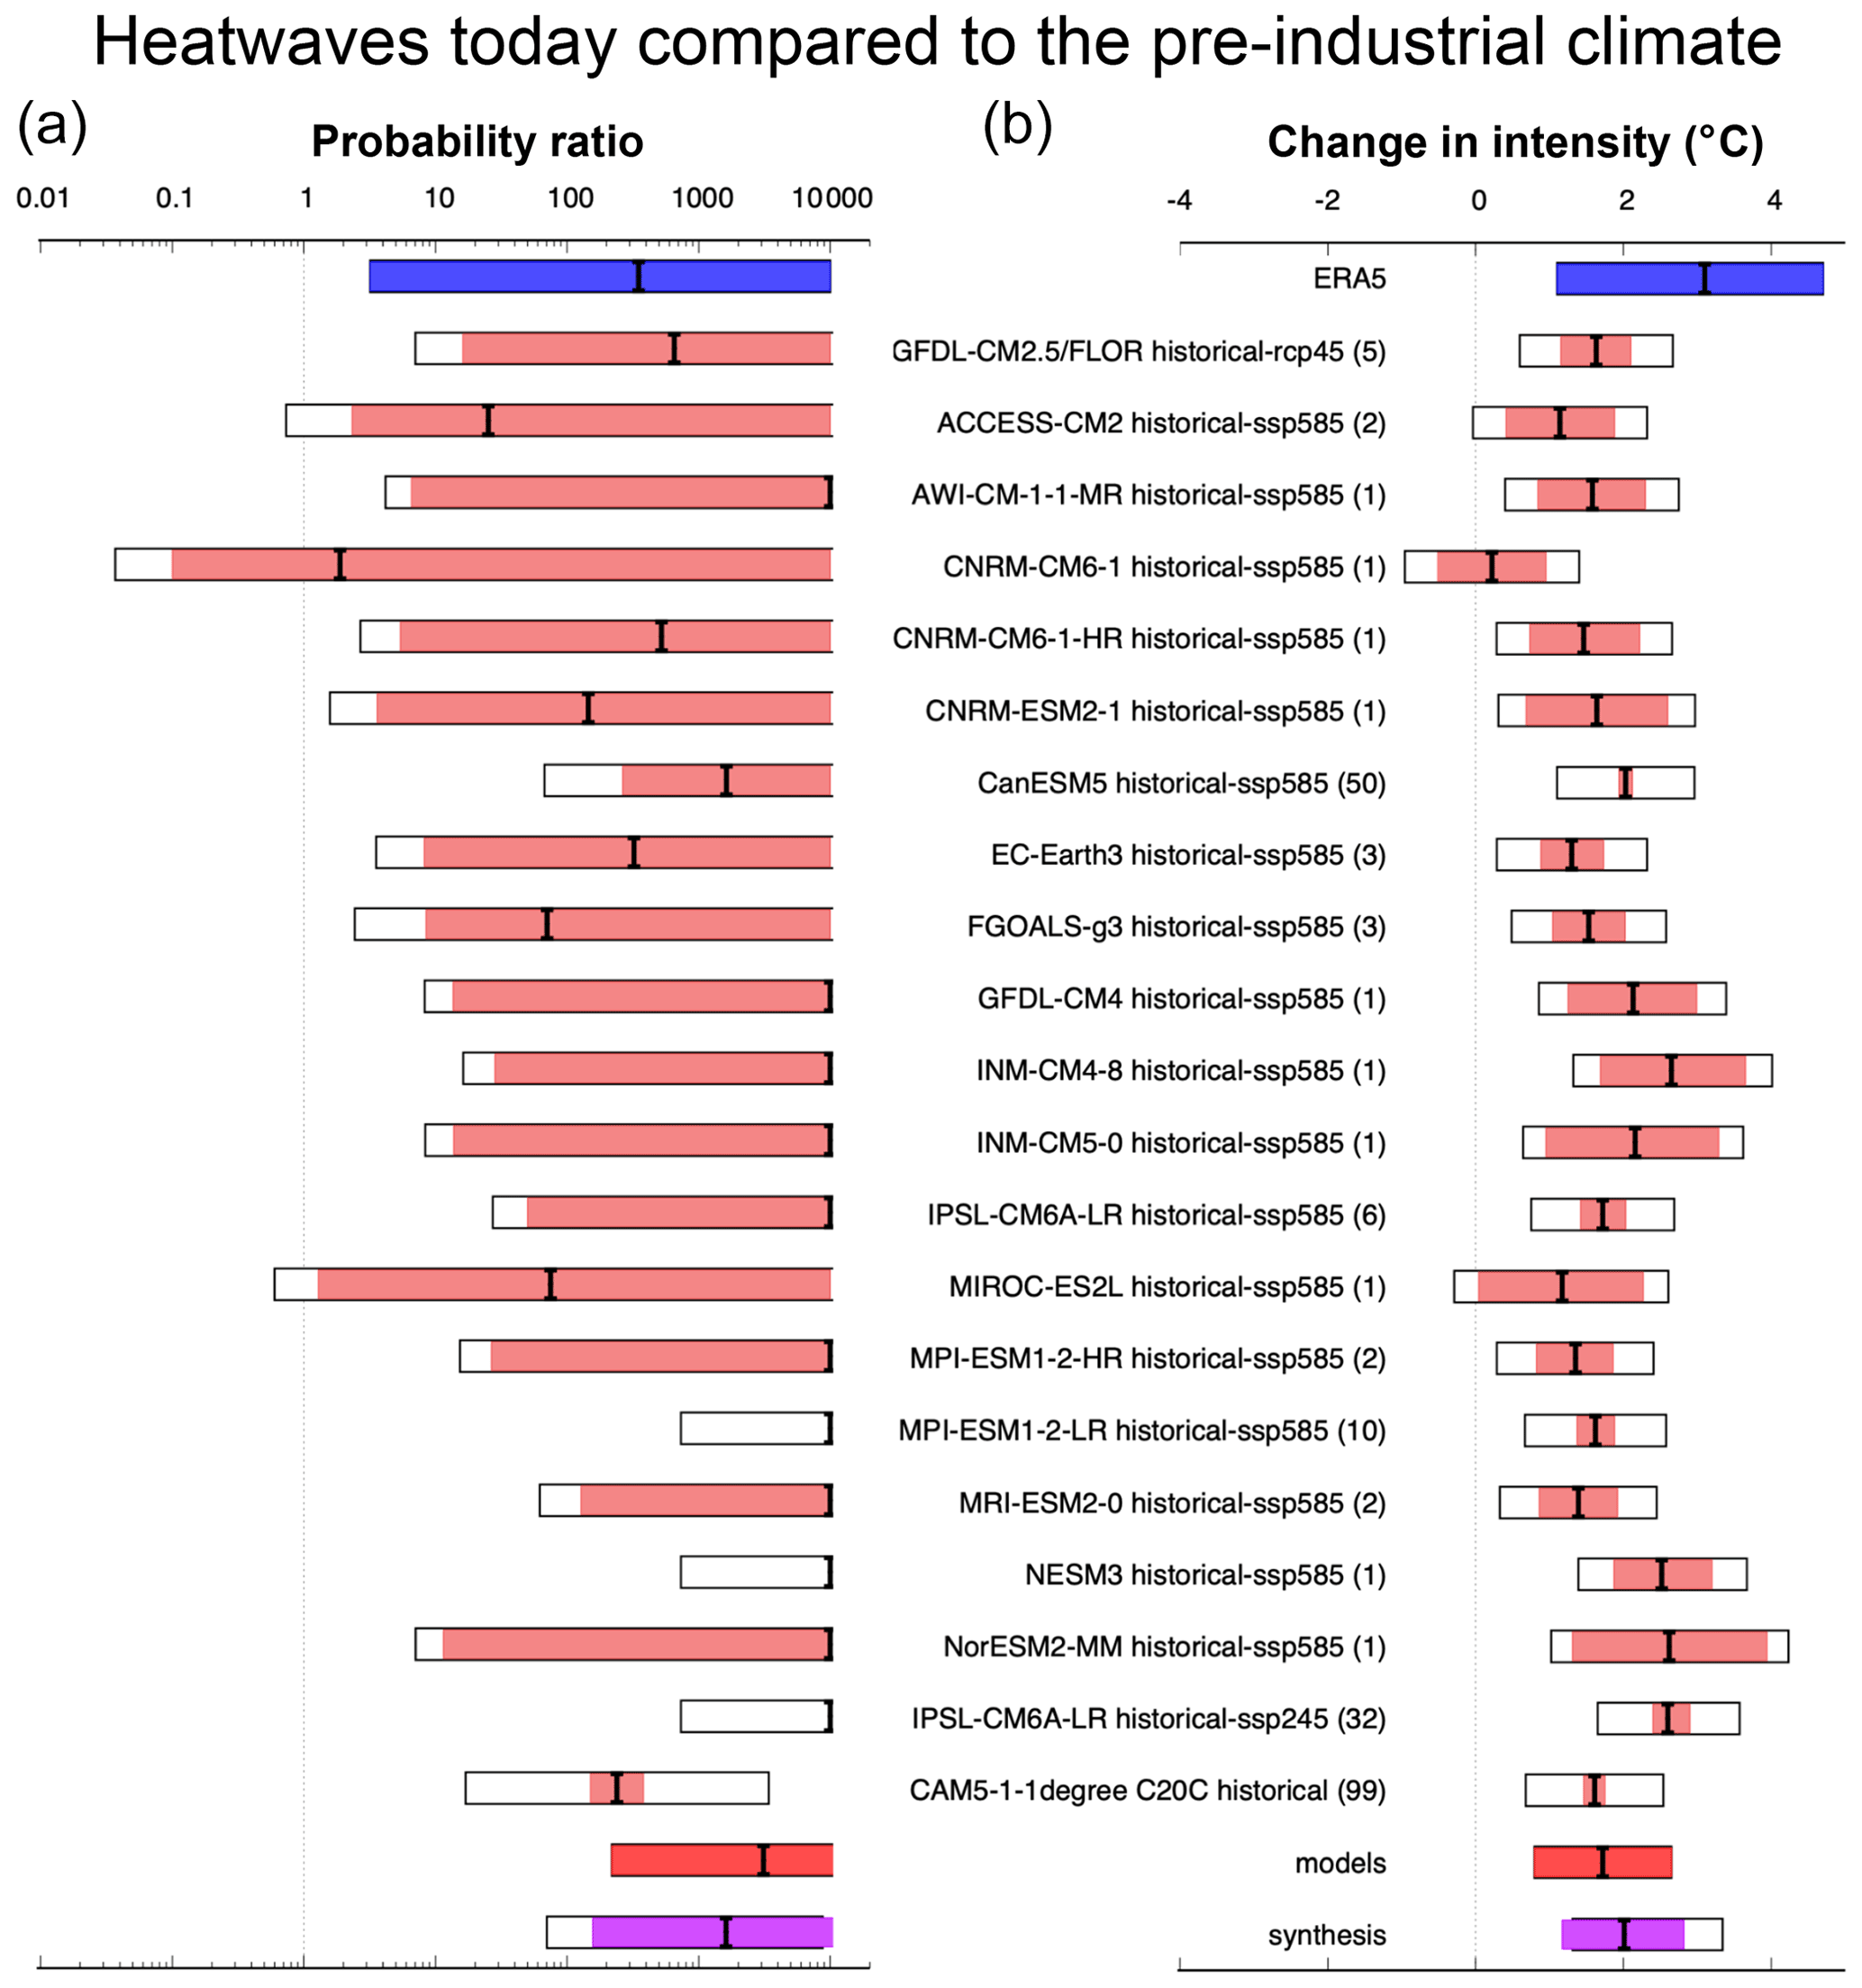
 Extreme weather and climate
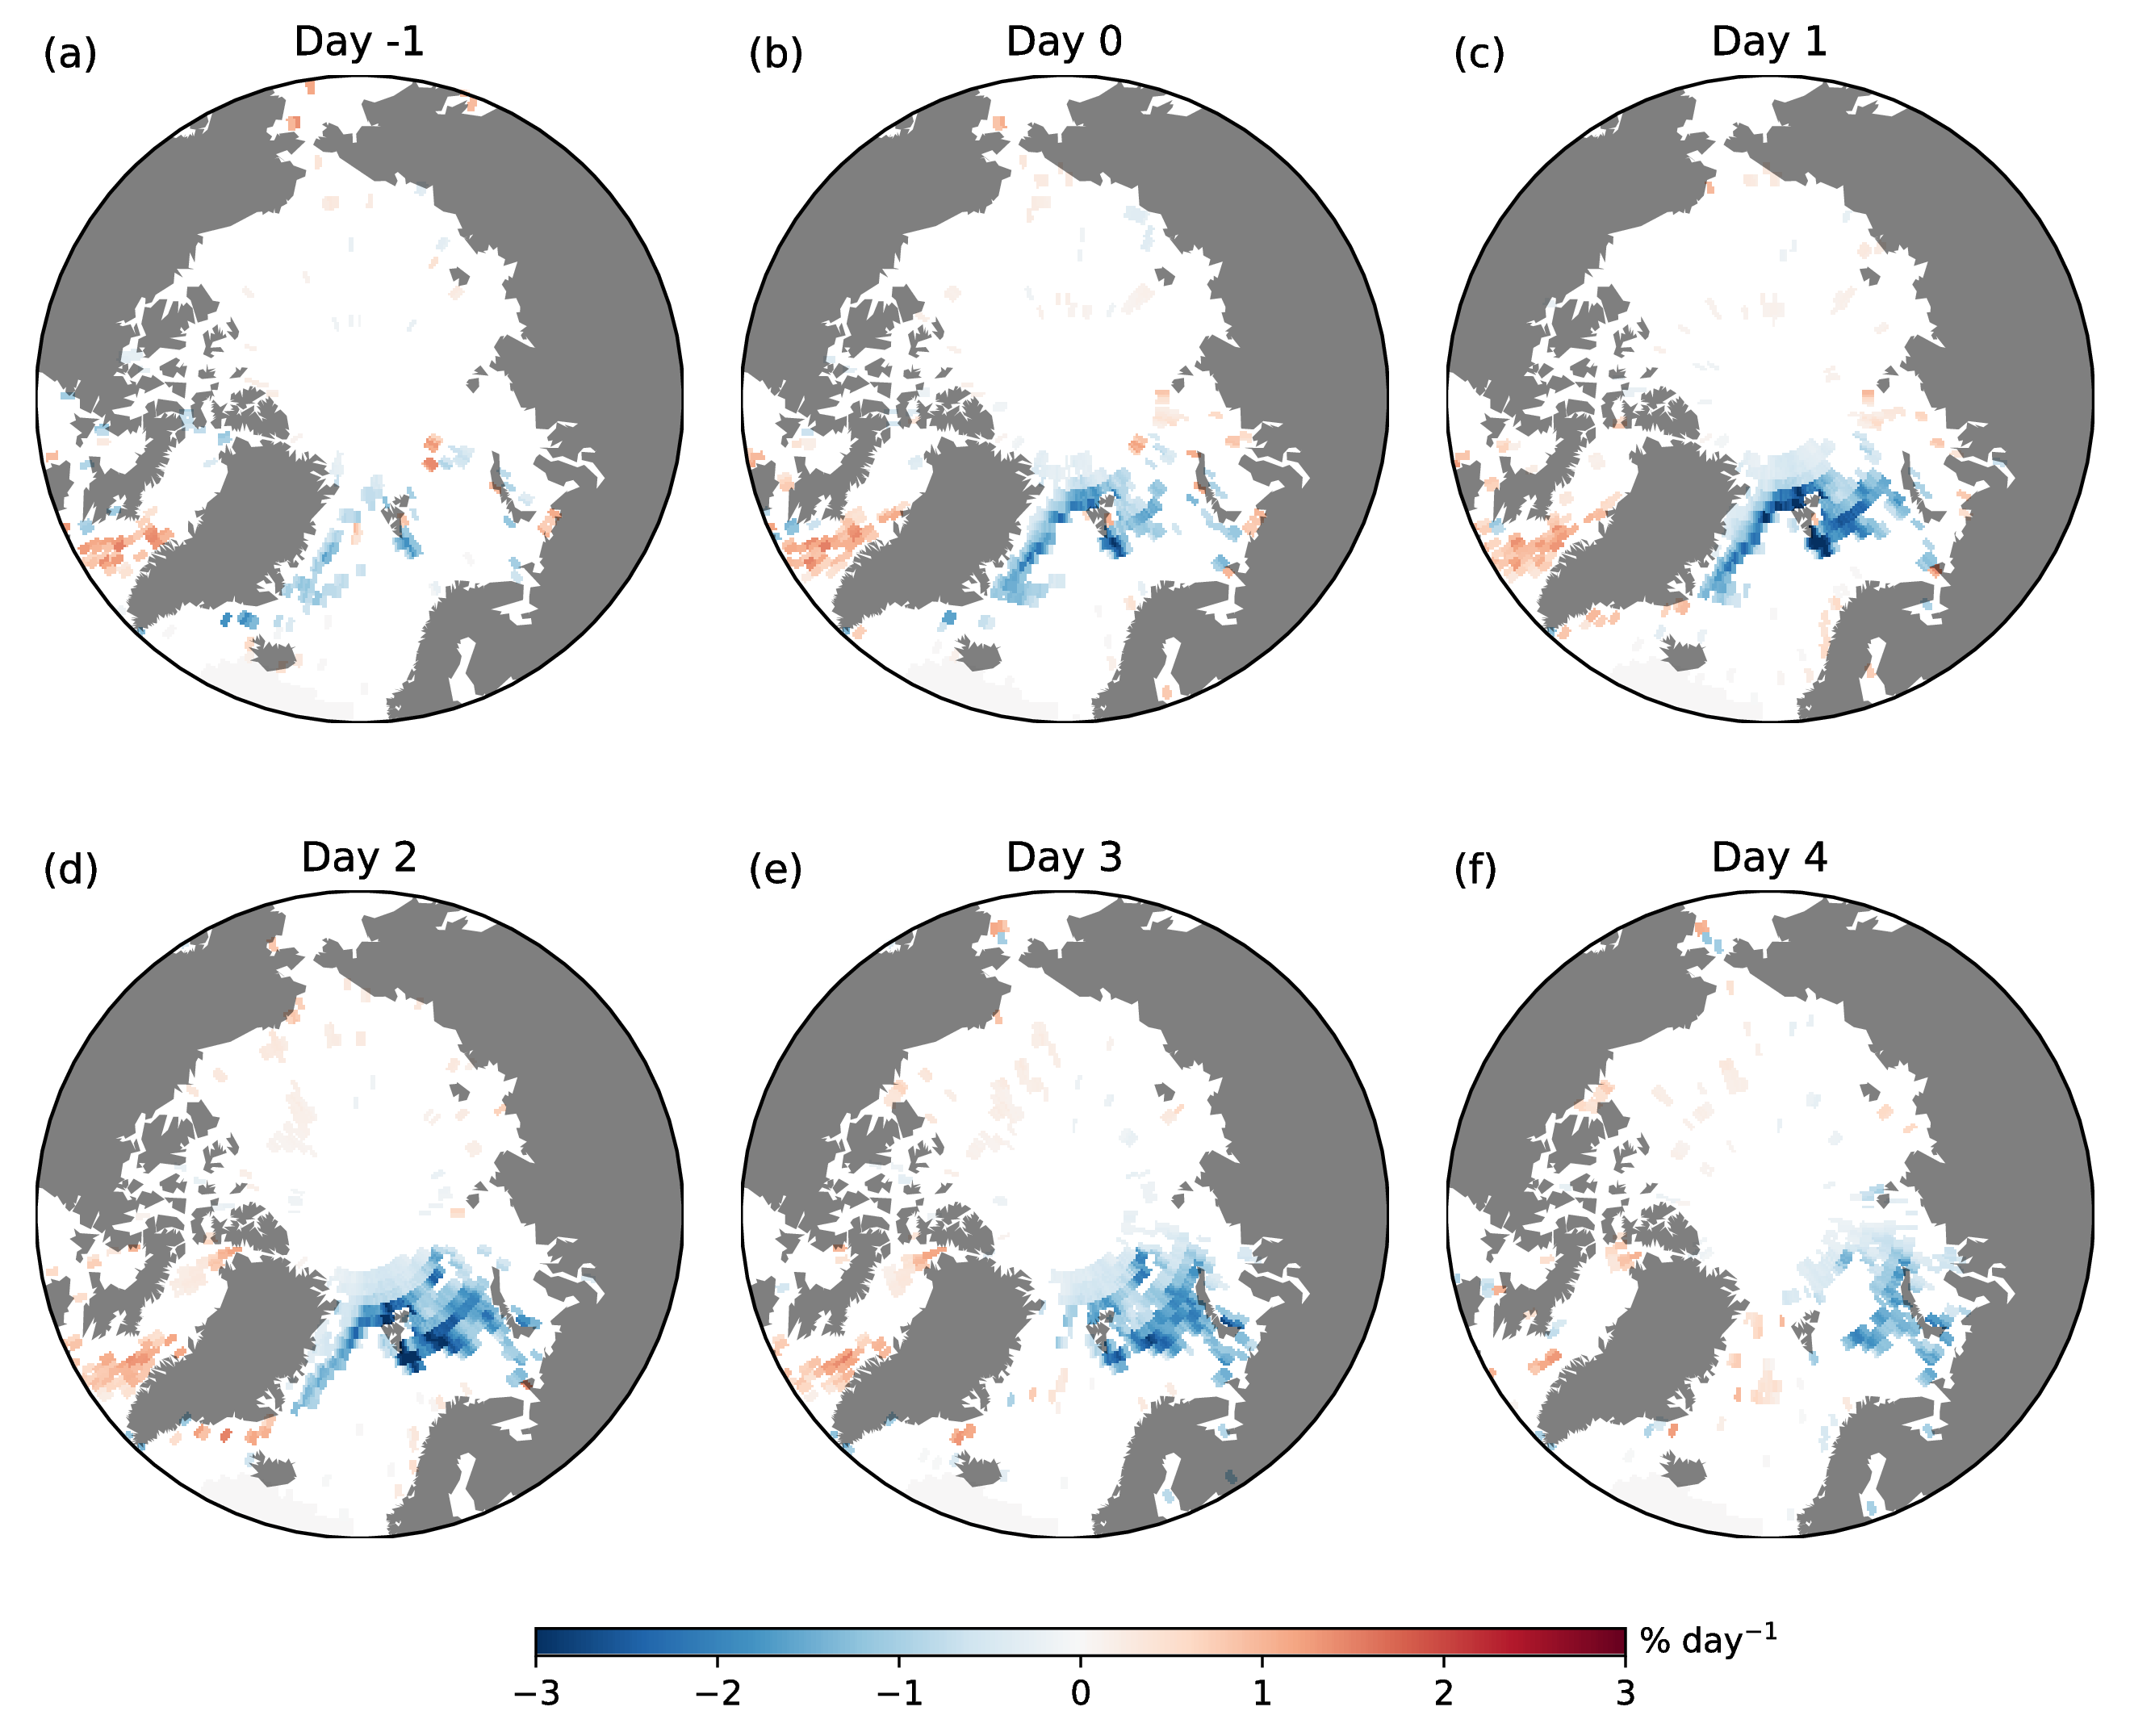
 Sea Ice Variability
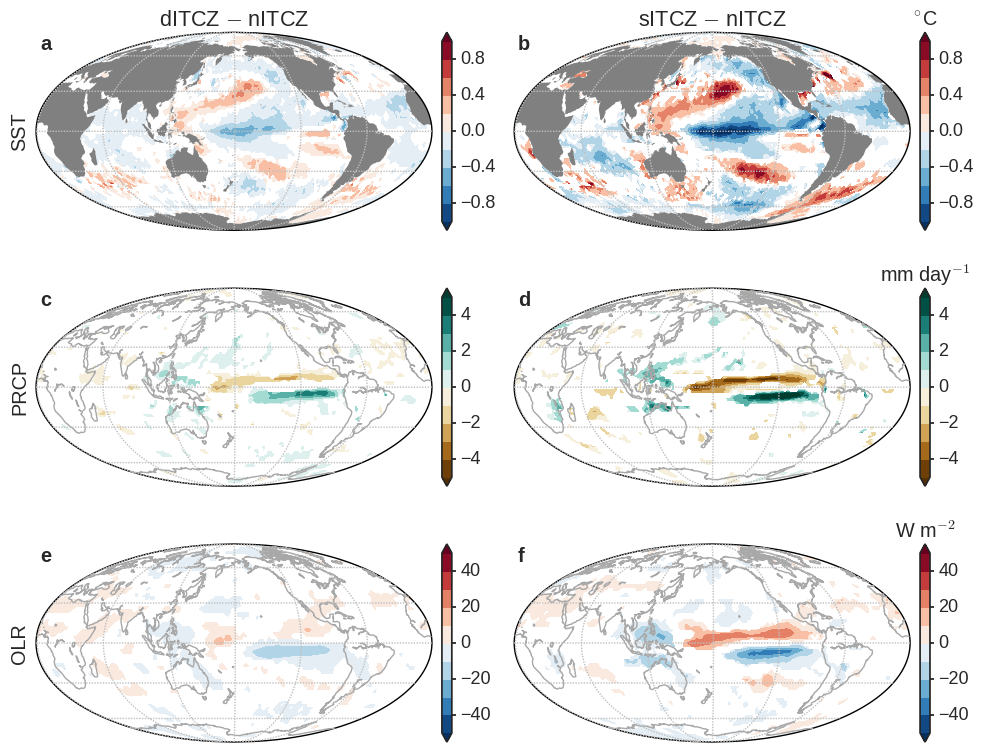
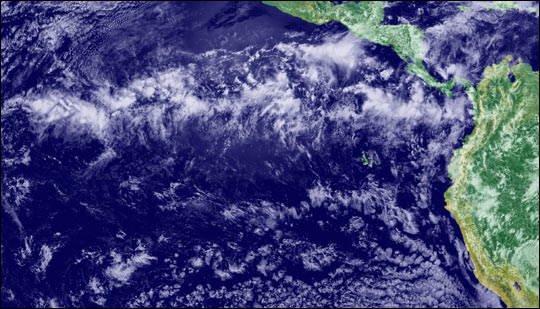 Inter-tropical Convergence Zone (ITCZ)
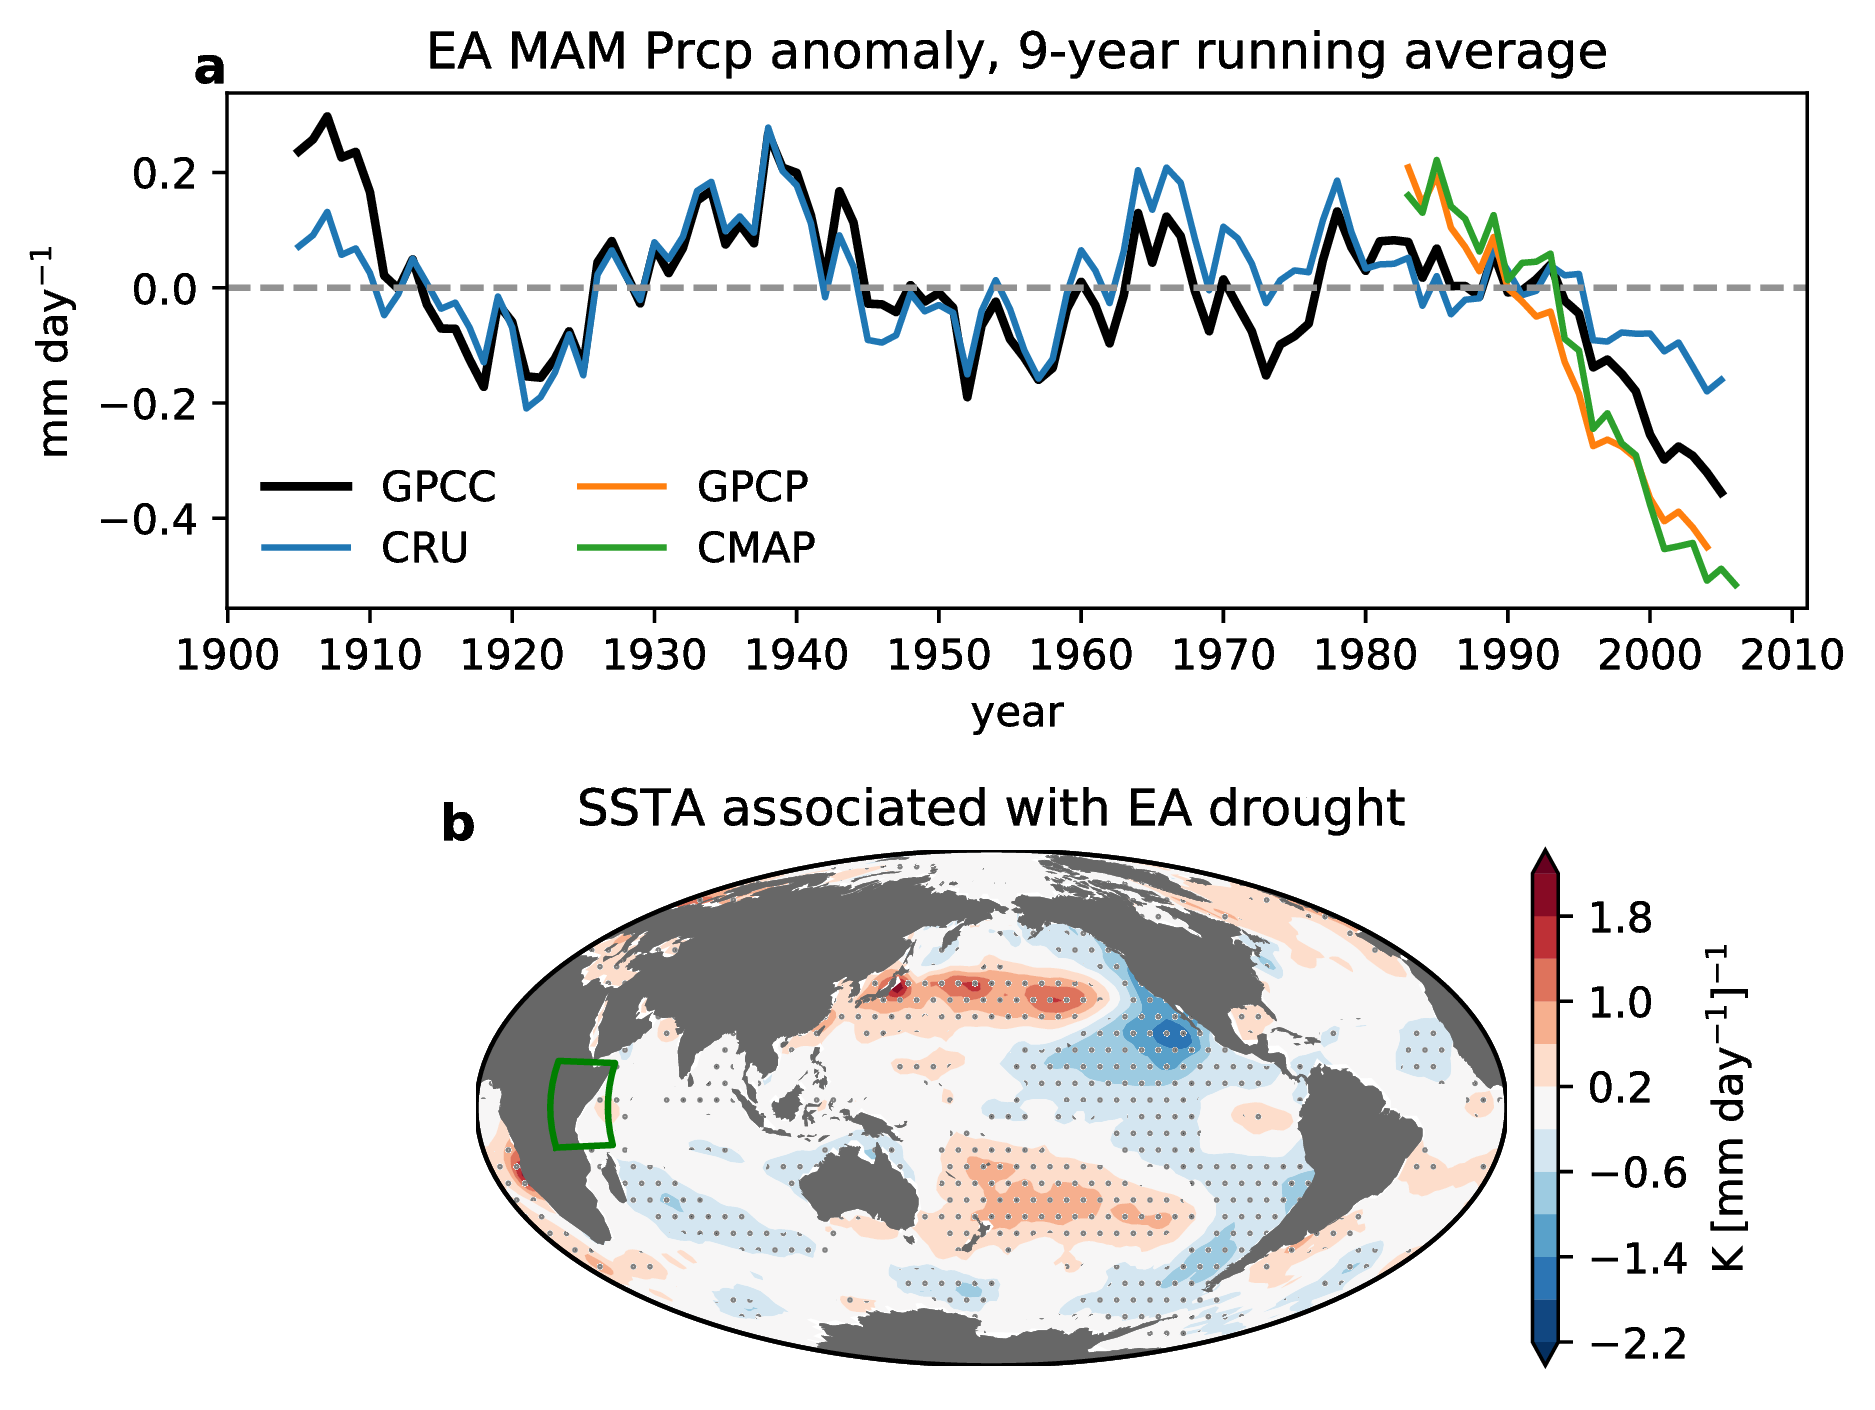
 East African Hydroclimate
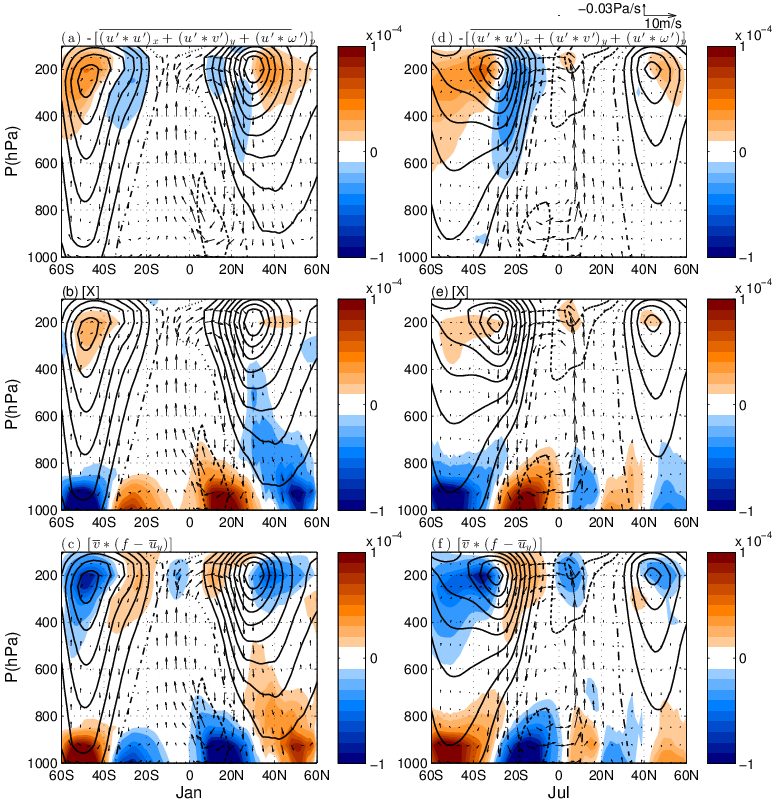
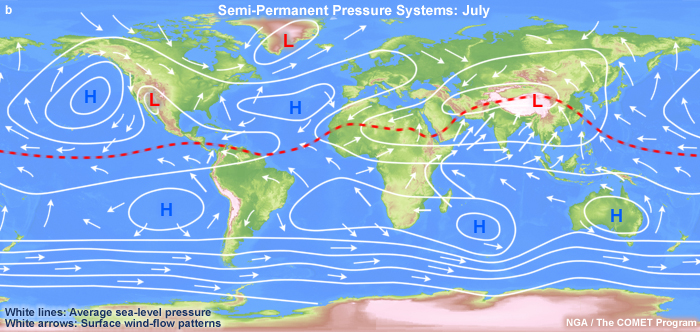 Tropical Atmospheric Circulation