Python
# the hello world program in python
print('Hello World!')
Popular Scientific Python Packages
import numpy as np
from scipy.fftpack import fft, ifft
x = np.random.randn(100)
y = fft(x)
yinv = ifft(y)

 Basemap
:
The matplotlib basemap toolkit is a library for plotting 2D data on maps in Python. It is similar in functionality to the matlab mapping toolbox, the IDL mapping facilities, GrADS, or the Generic Mapping Tools. (Deprecation Notice: Basemap is deprecated in favor of the Cartopy project.)
Basemap
:
The matplotlib basemap toolkit is a library for plotting 2D data on maps in Python. It is similar in functionality to the matlab mapping toolbox, the IDL mapping facilities, GrADS, or the Generic Mapping Tools. (Deprecation Notice: Basemap is deprecated in favor of the Cartopy project.)

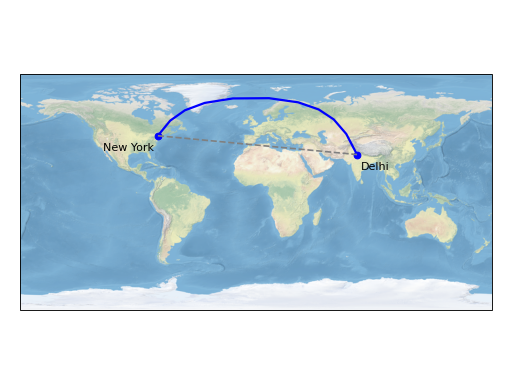
 Cartopy
:
Cartopy is a Python package designed for geospatial data processing in order to produce maps and other geospatial data analyses.
Cartopy
:
Cartopy is a Python package designed for geospatial data processing in order to produce maps and other geospatial data analyses.
import cartopy.crs as ccrs
import matplotlib.pyplot as plt

ax = plt.axes(projection=ccrs.PlateCarree())
ax.stock_img()

ny_lon, ny_lat = -75, 43
delhi_lon, delhi_lat = 77.23, 28.61

plt.plot([ny_lon, delhi_lon], [ny_lat, delhi_lat],
         color='blue', linewidth=2, marker='o',
         transform=ccrs.Geodetic(),
         )

plt.plot([ny_lon, delhi_lon], [ny_lat, delhi_lat],
         color='gray', linestyle='--',
         transform=ccrs.PlateCarree(),
         )

plt.text(ny_lon - 3, ny_lat - 12, 'New York',
         horizontalalignment='right',
         transform=ccrs.Geodetic())

plt.text(delhi_lon + 3, delhi_lat - 12, 'Delhi',
         horizontalalignment='left',
         transform=ccrs.Geodetic())
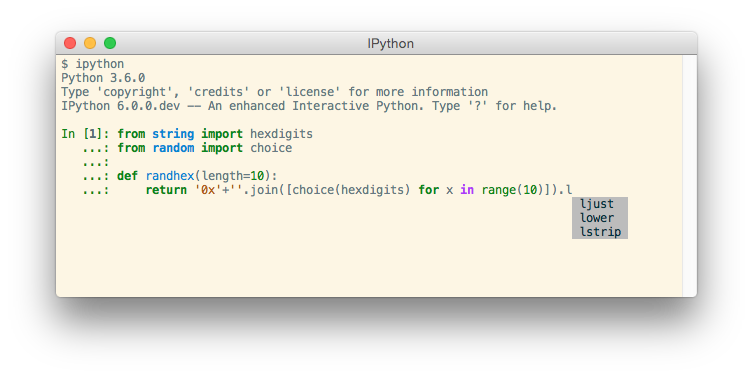
 IPython
 Pandas
:
The art of data analysis, especially for time series and table data
Pandas
:
The art of data analysis, especially for time series and table data
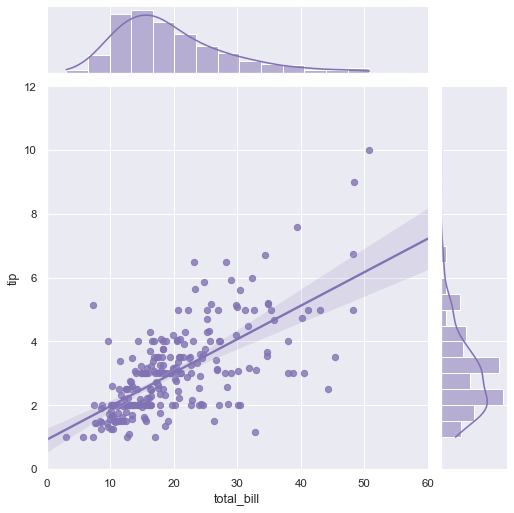
Seaborn :
A Python visualization library based on matplotlib. It provides a high-level interface for drawing attractive statistical graphics.


Install Python Packages
First, install Miniconda: Instruction
After Miniconda is installed, install the scientific Python packages using command conda install:
conda install numpy scipy matplotlib basemap ipython jupyter netcdf4 h5py pandas xarray dask bottleneck
You can also use conda install to install other python packages with similar syntax:
conda install PACKAGENAME
A talk on the stack of scientific Python.